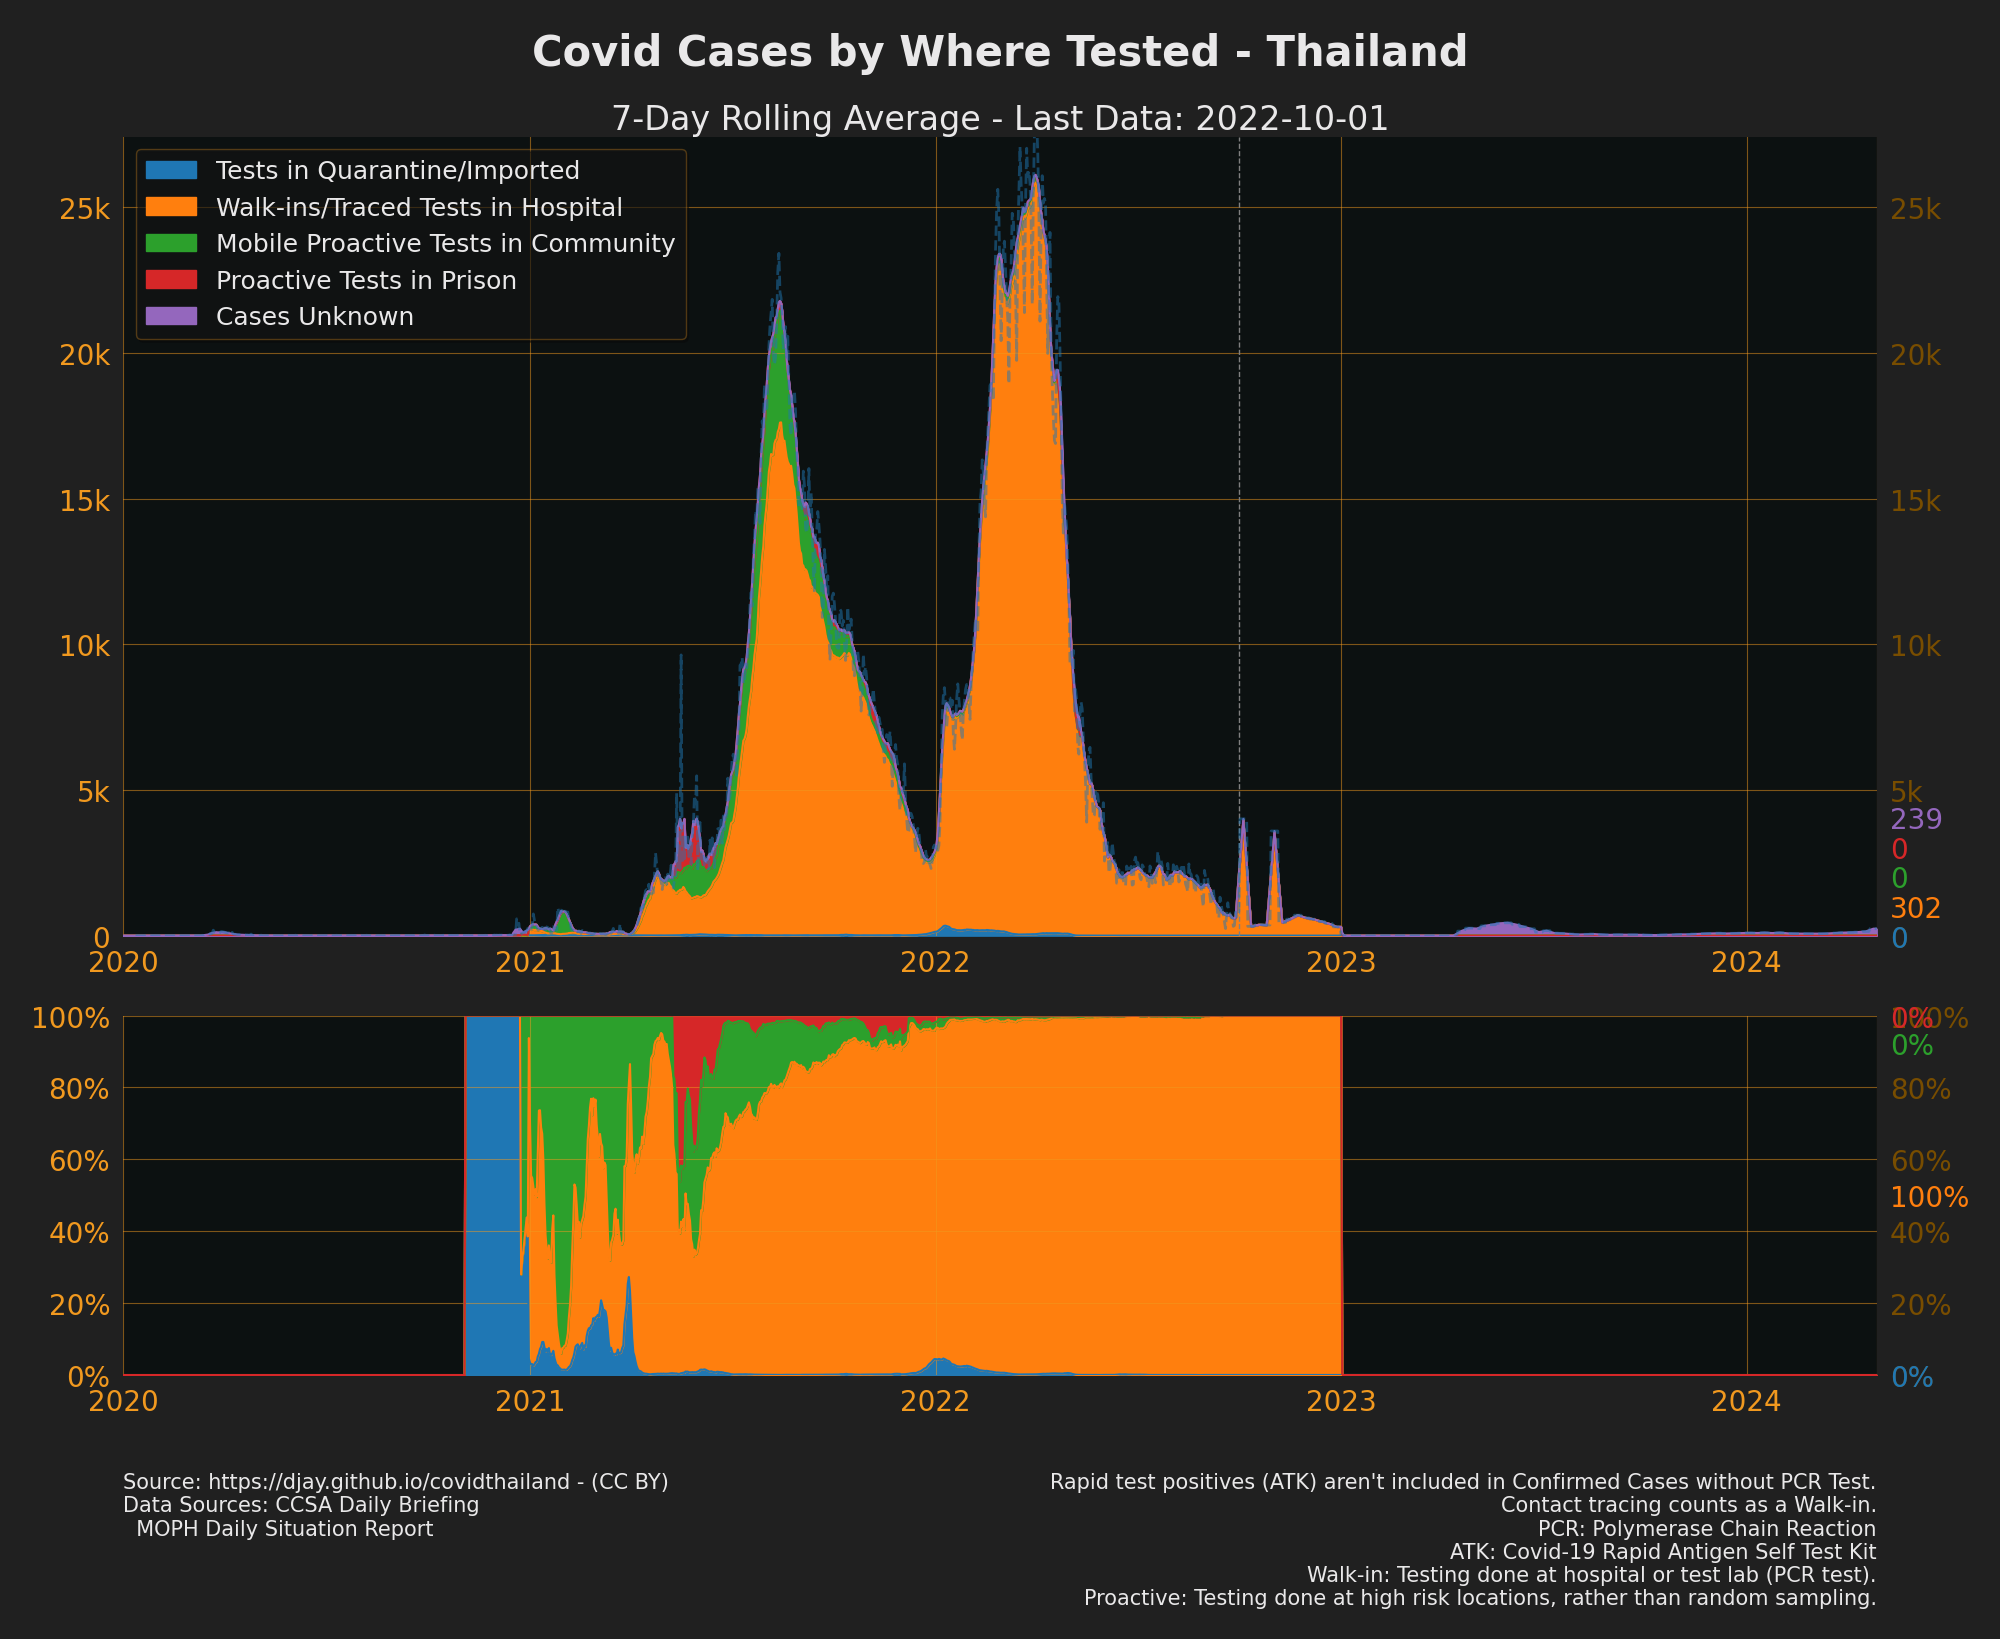
Covid Thailand Trends
Thailand Covid testing and case data gathered and combined from various sources for others to download or view
Project maintained by djay Hosted on GitHub Pages — Theme by mattgraham
Downloads
Combined
Note: from 2022-10-01 most data is weekly so daily numbers are an estimate only
Daily combined
combined.csv
- Source:
- Many of the daily sources combined
- plus COVID-19 report, periodic summary
- API: Details of all confirmed COVID-19 infections - 1-2 days delayed
- API: Daily Summary of Cases/Deaths/Recovered
- Daily infographics translated and tweeted Updated daily around midday (after gov briefing) - No Longer updated
See the current priority order when combining
Schema
| Column | |
|---|---|
| Cases Age {‘0-9’, ‘10-19’, ‘20-29’, ‘30-39’, ‘40-49’, ‘50-59’, ‘60-69’, ‘70+’} | |
| Cases Risk {Group} | Categorisation of Risk field from the covid-19-daily dataset |
| + See all the above for data definitions |
Combined per province
- Sources:
- Briefing by Province
- API timeline by Province
- Dashboard by Provice
- Tweets data by Province
- Risk Classification by Provice
- How these sources are combined
cases_by_province.json | cases_by_province.csv
Schema cases_by_province:
| Column | |
|---|---|
| “Date | e.g “2021-04-06” |
| “Province | e.g “Samut Sakhon” |
| “Health District Number | 1-13 - see Thailand Health Areas |
| “Cases | Confirmed cases in this province |
| “Deaths | 31.0 |
| Vac Given 1 Cum | null |
| Vac Given 2 Cum | null |
| Vac Given 3 Cum | null |
| The following comes from moph_dashboad_prov | |
| Cases Walkin | Confirmed cases found those requesting tests or asked to from contact tracing or the media. Paid or having met the PUI criteria. |
| Cases Proactive | Confirmed cases found government has gone to specific areas to mass test due to high risk of COVID-19. |
| Cases Area Prison | see moph_dashboad_prov |
| Positive Rate Dash | see moph_dashboad_prov |
| Tests | see moph_dashboad_prov. No longer updated |
Combined per Health District
cases_by_area.json, cases_by_area.csv
Schema cases_by_area:
| Column | |
|---|---|
| Date | e.g “2021-04-06” |
| Cases Area {1-13} | Confirmed cases in a given Health Area |
| Deaths Area {1-13} | Deaths that day in the health district |
| Cases Risk {Group} Area {1-13} | Categorisation of Risk field from the covid-19-daily dataset |
| The following are no longer updated but have some historical data | |
| Cases {Proactive,Walkin} Area {1-13} | Cases found by people where tested |
- Notes:
- Thailand Health Areas


Daily CCSA Briefings
- Sources
- CCSA Daily Briefing - No longer updated
cases_briefings.json | cases_briefings.csv
Schema:
| Column | |
|---|---|
| Date | e.g “2021-04-06” |
| Cases | Total cases that day. (Cases Imported + Cases Local Transmission) |
| Cases In Quarantine | “Cases found in quarantine facilities/centers” |
| Cases Imported | Cases In Quarantine + Cases outside quarantine |
| Cases Proactive | Local transmissions that aren’t walk-ins |
| Cases Local Transmission | “Cases infected in Thailand”. Cases Walkins + Cases Proactive |
| Cases Area Prison | Cases reported in prison on this date |
| Hospitalized | Total currently in isolation in hospital or field hospital |
| Hospitalized Field | Total currently in isolation in field hospitals |
| Hospitalized Hospital | total current active cases - anyone confirmed is considered hospitalized currently |
| Hospitalized Severe | Currently hospitalised in a severe condition. Unclear what kind of beds this entails. |
| Hospitalized Respirator | Current number in severe condition requiring ICU and mechanical ventilator |
| Recovered | Number released from hospital/field hospital on this date |
| Deaths | Number of deaths annouced that day |
| Deaths Age (Min,Max) | Range of ages of those who died |
| Deaths Age Median | Median age of those who died |
| Deaths Comorbidity {comorbidity} | Deaths where a particular comorbidity was present |
| Deaths Comorbidity None | Deaths where there wasn’t a disease that increased risk |
| Deaths {Female,Male} | Deaths for 2 of the genders |
| Deaths Risk {risk} | Risks that are the likely cause of catching the virus e.g. Family |
| Tests ATK Proactive | Number of ATK free tests taken (likely NHSO provided) |
| Pos ATK Proactive | Number of ATK free test positive results (likely NHSO provided) |
| Infections Non-Hospital Cum | Unexplained: ATK + something else? |
| Vac Given | |
| Vac Given {1-3} | Daily vaccinations |
| Vac Given {1-3} Cum | |
| Vac Given {group} {1-3} Cum | |
| Source Cases | Tweet, api or briefing the primary information came from |
| Fields no longer updated | |
| Cases (Asymptomatic,Symptomatic) | - No longer reported in briefing reports |
Deaths by Province
deaths.json, deaths.csv
Source: briefing reports
Schema
| Column | |
|---|---|
| Date | 2021-04-27 |
| death_num | 149.0 |
| gender | Male” |
| nationality | ไทย” |
| age | 47.0 |
| Province | Bangkok” |
| Following information is extracted by not properly parsed yet | |
| congenital_disease | |
| case_history | |
| risk_factor_sickness | |
| risk_factor_death |
- Notes:
- Stopped being published 2021-04-28. Only summary data in cases_by_area is continuing
MOPH Covid-19 Dashboard
- Sources MOPH Covid-19 Dashboard
Dashboard by Week
From 2022-10-01 daily dashboard was replaced with a weekly summary
moph_dash_weekly.csv
source - https://ddc.moph.go.th/covid19-dashboard/?dashboard=main
Schema
| Column | |
|---|---|
| Date | |
| Cases Cum | Seems to be only hospitalised cases |
| Deaths Cum | |
| Hospitalized Respirator | Presumably means currently on ventilation |
| Hospitalized Severe | Unclear if this is just condition or signifies a different bed type |
| Vac Given {1-3} Cum |
Dashboard by Province by Week
moph_province_weekly.csv
Source - https://ddc.moph.go.th/covid19-dashboard/?dashboard=province
Schema
| Column | |
|---|---|
| Date | |
| Province | |
| Cases Cum | |
| Deaths Cum | |
| Vac Given {1-3} Cum |
Dasboard by day
From 2022-10-01 no longer updated. see weekly
moph_dashboard.csv
source - https://ddc.moph.go.th/covid19-dashboard/?dashboard=main
Schema
| Column | |
|---|---|
| Date | |
| ATK | Probable cases/ATK Positives. Most likely represents those registered for home isolation without a PCR test |
| Cases | |
| Cases Area Prison | |
| Cases Imported | |
| Cases Proactive | |
| Cases Walkin | |
| Deaths | |
| Hospitalized | |
| Hospitalized Field | Hospitalized Field HICI + Hospitalized Field Hospitel + Hospitalized Field Other |
| Hospitalized Field HICI | Current confirmed cases (PCR tested) in home isolation or community isolation centers |
| Hospitalized Field Hospitel | Field hospital in a hotel |
| Hospitalized Field Other | |
| Hospitalized Hospital | |
| Hospitalized Respirator | Presumably means currently on ventilation |
| Hospitalized Severe | Unclear if this is just condition or signifies a different bed type |
| Recovered | Newly released from isolation on this day |
| Vac Given {1-3} Cum | |
| Tests | No longer updated. Didn’t match the numbers of tests in the testing reports. Possibly because it was released earlier? |
| Positive Rate Dash | The pre-calculated positive rate shown on the dashboard. It is already 7 day averaged. Doesn’t match exactly the calculated value from the test reports |
| Source Cases |
Dashboard by Province
moph_dashboard_prov.csv
Source - https://ddc.moph.go.th/covid19-dashboard/?dashboard=province
Schema
| Column | |
|---|---|
| Date | |
| Cases | |
| Cases Area Prison | |
| Cases Imported | |
| Cases Proactive | |
| Cases Walkin | |
| Deaths | |
| Tests | No longer updated |
| Vac Given {1-3} Cum | |
| Positive Rate Dash | The pre-calculated positive rate shown on the dashboard. It is already 7 day averaged. Doesn’t match exactly the calculated value from the test reports |
Dashboard by Age
moph_dashboard_ages.csv
source - https://ddc.moph.go.th/covid19-dashboard/?dashboard=select-trend-line
Schema
| Column | |
|---|---|
| Date | |
| Cases Age {age-group} | |
| Deaths Age {age-group} | |
| Cases Proactive Age {age-group} |
Age groups are {‘0-9’, ‘10-19’, ‘20-29’, ‘30-39’, ‘40-49’, ‘50-59’, ‘60-69’, ‘70+’}
Daily Situation Reports
Case Types and PUI counts
Note: no longer updated as of 2022-07-01
situation_reports.json | situation_reports.csv
- Sources:
- MOPH daily situation report PDFs (Updated daily in the evening)
- MOPH daily situation report PDFs (english translations) (Updated a few days later)
- DDC Website - Today’s PUI count

Schema
- no longer updated *
| Column | |
|---|---|
| Date | e.g “2021-04-06” |
| Cases | Total cases that day. Cases Imported + Cases Local Transmission |
| Cases In Quarantine | “Cases found in quarantine facilities/centers” |
| Cases Imported | Cases In Quarantine + Cases outside quarantine |
| Cases Proactive | Local transmissions that aren’t walk-ins |
| Cases Local Transmission | “Cases infected in Thailand”. Cases Walkins + Cases Proactive |
| Tested PUI | People Classified as Person Under Investigation. |
| Tested PUI Walkin Public | “Sought medical services on their own at hospitals”/Public |
| Tested PUI Walkin Private | “Sought medical services on their own at hospitals”/Private |
| The following are included but are not useful data since 2020-08. | |
| Tested | Not different from PUI since 2020-08 says “Total number of laboratory tests” but is mislabeled. |
| Tested Quarantine | Not changed since 2020-08. “Returnees in quarantine facilities/centers”. |
| Tested Proactive | Not changed since 2020-08.Tested from “active case finding”. |
| Tested Not PUI | Not changed since 2020-08. “People who did not meet the PUI criteria”. |
- Notes:
- The only useful Tested number is “Tested PUI”.
- All the daily numbers have cumulative raw data columns (ending in “Cum”) from which the daily numbers are calculated
- except for all the Cases numbers from 2020-11-02 where daily numbers are taken from the reports
- to calculate daily numbers missing data is interpolated
- The following aren’t yet included but in the reports
- Screened Ports: “Type of Screened People and PUI / Ports of entry (Airports, ground ports, and seaports)”
- Screened Immigration “Type of Screened People and PUI / People renewing their passports at the Immigration Bureau, Chaeng Watthana” Bureau, Chaeng Watthana”
- Data found in other places e.g.
- Deaths
- Recovered
- Hospitalized
Testing Reports
- Source:
- DMSC: Thailand Laboratory testing data - weekly summary reports (updated weekly but sporadic)
- also available via data.go.th testing data
- Other info on lab network
- This datasource seems incomplete as not all tests go via this DMSc’co-lab database. In particular times with large amounts of proactive testing sometimes result in more cases reported than positive results.


Daily Tests Private+Public
tests_pubpriv.json | tests_pubpriv.csv
Schema
| Column | |
|---|---|
| Date | e.g “2021-04-06” |
| Tests | PCR tests |
| Tests Private | PCR tests from private labs. no longer updated |
| Pos | Positive result |
| Pos Private | Positive result from private labs. no longer updated |
| Pos XLS | Tests positive results (includes corrected date-less data) |
| Tests XLS | Tests conducted (includes corrected date-less data) |
- Notes:
- Uses case history graphs from the latest PPTX
- data seems to exclude some non-PCR tests (likely used in some proactive testing)
- The Test XLS data includes a number of tests and results for which the date is unknown. This has been redistributed into the Pos XLS and Tests XLS numbers. Other than this it
should be the same numbers as
PosandTests.
Tests by Health District
tests_by_area.json | tests_by_area.csv
Schema
| Column | |
|---|---|
| Start | e.g “2021-04-06” |
| End | e.g “2021-04-13” |
| Pos Area {1-13} | Positive test results (PCR) |
| Tests Area {1-13} | Total tests (PCR) |
- Notes:
- not all periods are a week
- data seems to exclude non-PCR tests (likely used in some proactive testing)
- There are missing files, so some weeks’ data are not shown
- The example graphs shown have been extrapolated using daily totals from the test daily data
Variant Reports
- Source:
- DMSC: Variant Report
Variants by Major Group
Comes from XLS
variants.csv
Schema
| Column | |
|---|---|
| End | e.g “2021-04-13” |
| {Variant ID (Variant Group)} | Number of samples |
Variants Sequenced (Weekly)
Comes from pdf tables - “Prevalence of Pangolin lineages in the Thailand with sequence data”
variants_sequenced.csv
Schema
| Column | |
|---|---|
| End | e.g “2021-04-13” |
| {Variant ID} | Number of samples |
Variants via PCR by Health District (Weekly)
Comes from PDF Tables - “Random selection for screening by real-time PCR”
variants_by_area.csv
Schema
| Column | |
|---|---|
| End | e.g “2021-04-13” |
| Health District | e.g 13 |
| {Variant ID (Variant Group)} | Number of samples |
Vaccination Downloads
Vaccination data is also available from the Dashboard, Briefing Reports and this is all combined in the Combined CSV
Daily DDC Vaccination Reports
vac_timeline.csv
Schema
| Column | Notes | |
|---|---|---|
| Date | 2021-04-25 | |
| Vac Allocated {Sinovac/AstraZeneca} {dose} | 3840.0 | No longer updated |
| Vac Delivered | 200.00 | No longer updated |
| Vac Given {dose} Cum | 3189.0 | |
| Vac Given {dose} % | 83.0 | |
| Vac Group Medical Staff {dose} Cum | 1939.0 | |
| Vac Group Other Frontline Staff {dose} Cum | 1081.0 | |
| Vac Group Over 60 {dose} Cum | 0.0 | ผู้ที่มีอายุ 60 ปีขึ้นไป |
| Vac Group Risk: Disease {dose} Cum | 54.0 | 7 at risk Diseases |
| Vac Group Risk: Location {dose} Cum | 115.0 | General population |
| Vac Group Students {dose} Cum | 115.0 | 12-17yo ผู้ที่มีอายุ12 177ปี |
| Vac Group Kids {dose} Cum | 115.0 | 5-11yo ผู้ที่มีอายุ 5 11 ปี |
| Vac Group Infant {dose} Cum | 115.0 | 0.5-4yo - ผู้ที่มีอายุ 6 เดือน 44ปี |
| Vac Given {Sinovac/AstraZeneca/Sinopharm/Pfizer/Moderna} {dose} Cum | 3189.0 |
- Note
- “Vaccinations Given 1/2 %” refers to the % of allocation, not against population.
- dose is 1-6 currently
- Some days some tables are images so there is missing data.
- Summary vaccination data included in the combine download
- Delivered Vaccines comes from Track and Traceability Platform - no longer updated
COVID-19 Vaccines by Province
vaccinations.csv
- Source: DDC Daily Vaccination Reports
Schema
| Column | Notes | |
|---|---|---|
| Date | 2021-04-25” | |
| Province | “Bangkok” | |
| Vac Given {dose} Cum | 3189.0 | |
| Vac Given {dose} % | 83.0 | |
| Vac Allocated {vaccine} {dose} | no longer updated | |
| Vac Group {group} {dose} Cum | See above for risk groups. No longer updated | |
| Vac Population | The estimated population for this province | |
| Vac Population {group} | The estimated group population for this province |
BORA Monthly Deaths (Excess Deaths)
All Deaths in thailand (Monthly)
deaths_all.csv
Total deaths from all causes by province, month, age, gender
Schema:
| Column | |||
|---|---|---|---|
| Year | 2012-2021 | ||
| Month | 1-12 | ||
| Province | |||
| Gender | Male | Female | |
| Age | 0-101 | ||
| Deaths |